> Stem - and - Leaf Plot <
Stem - and - Leaf Plot
A Stem - and - Leaf Plot is use to organize numbers
(data). The stem represents the greatest place value
of all the numbers. The leaves represents the next
place value.
Example of a stem and leaf plot.
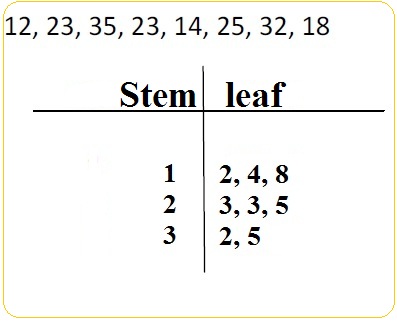
The digits on the left hand column is called the stem.
The digits on the right is called the leaf.