Tree Diagram
Used in probability to show all of the
possible outcomes or combinations of an event.
A box has 1 red ball, 1 green ball
and 1 blue ball, 2 balls are drawn
from the box one after the other,
without replacing the first ball
drawn. Use the tree diagram to
find the number of possible
outcomes for the experiment.
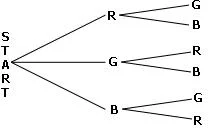
The possible outcomes are RG, RB,
GR, GB, BG and BR.
So, the number of possible
outcomes is 6.
More about probability