> Pictographs <
Pictographs
Pictograph are graphs that use pictures or symbols
to show data.
The key for a pictograph tells the number that each picture
or symbol represents.
example: Pictograph
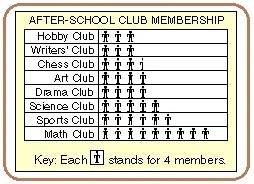
The pictograph above shows the number of students in after
school clubs. How many students are in the math club?
Count the math club figures. Then use the key.
There are 9 math club figures.
Each figure represents 4 members.
Multiply 9 x 4 to find the number of members.
9 x 4 = 36
There are 36 students in the math club.